
Equity in this table is the share of the pot if the board is run out now: wins, plus half the ties. The suits are part of the count. Aces against kings win 81.3% when the suits do not overlap, and 82.6% when the kings share both suits with the aces, because some flush runouts disappear.
| Matchup | Exact cards | Win | Tie | Equity |
|---|---|---|---|---|
| Aces vs kings | AsAh vs KdKc | 81.1% | 0.4% | 81.3% |
| Aces vs kings, suits shared | AsAh vs KsKh | 82.4% | 0.5% | 82.6% |
| Kings vs ace-king offsuit | KsKh vs AdKc | 69.6% | 0.8% | 70.0% |
| Ace-king suited vs queens | AsKs vs QdQh | 46.0% | 0.4% | 46.2% |
| Ace-king offsuit vs queens | AsKd vs QcQh | 42.7% | 0.3% | 42.8% |
| Deuces vs ace-king offsuit | 2s2h vs AdKc | 52.7% | 0.6% | 53.0% |
| Jacks vs ace-king suited | JsJh vs AdKd | 53.7% | 0.4% | 53.9% |
| Ace-king vs ace-queen, dominated | AsKd vs AhQc | 71.7% | 4.6% | 74.0% |
| King-queen vs ace-king, dominated | KsQd vs AhKc | 25.3% | 1.1% | 25.8% |
| Ace-five suited vs king-queen | As5s vs KdQc | 60.4% | 0.5% | 60.6% |
| Jack-ten suited vs ace-king | JsTs vs AdKc | 41.0% | 0.4% | 41.2% |
| Queens vs jacks | QsQh vs JdJc | 81.1% | 0.4% | 81.3% |
| Seven-six suited vs aces | 7s6s vs AdAh | 22.9% | 0.3% | 23.0% |
| Ace-deuce vs king-jack | As2d vs KhJc | 57.1% | 0.5% | 57.4% |
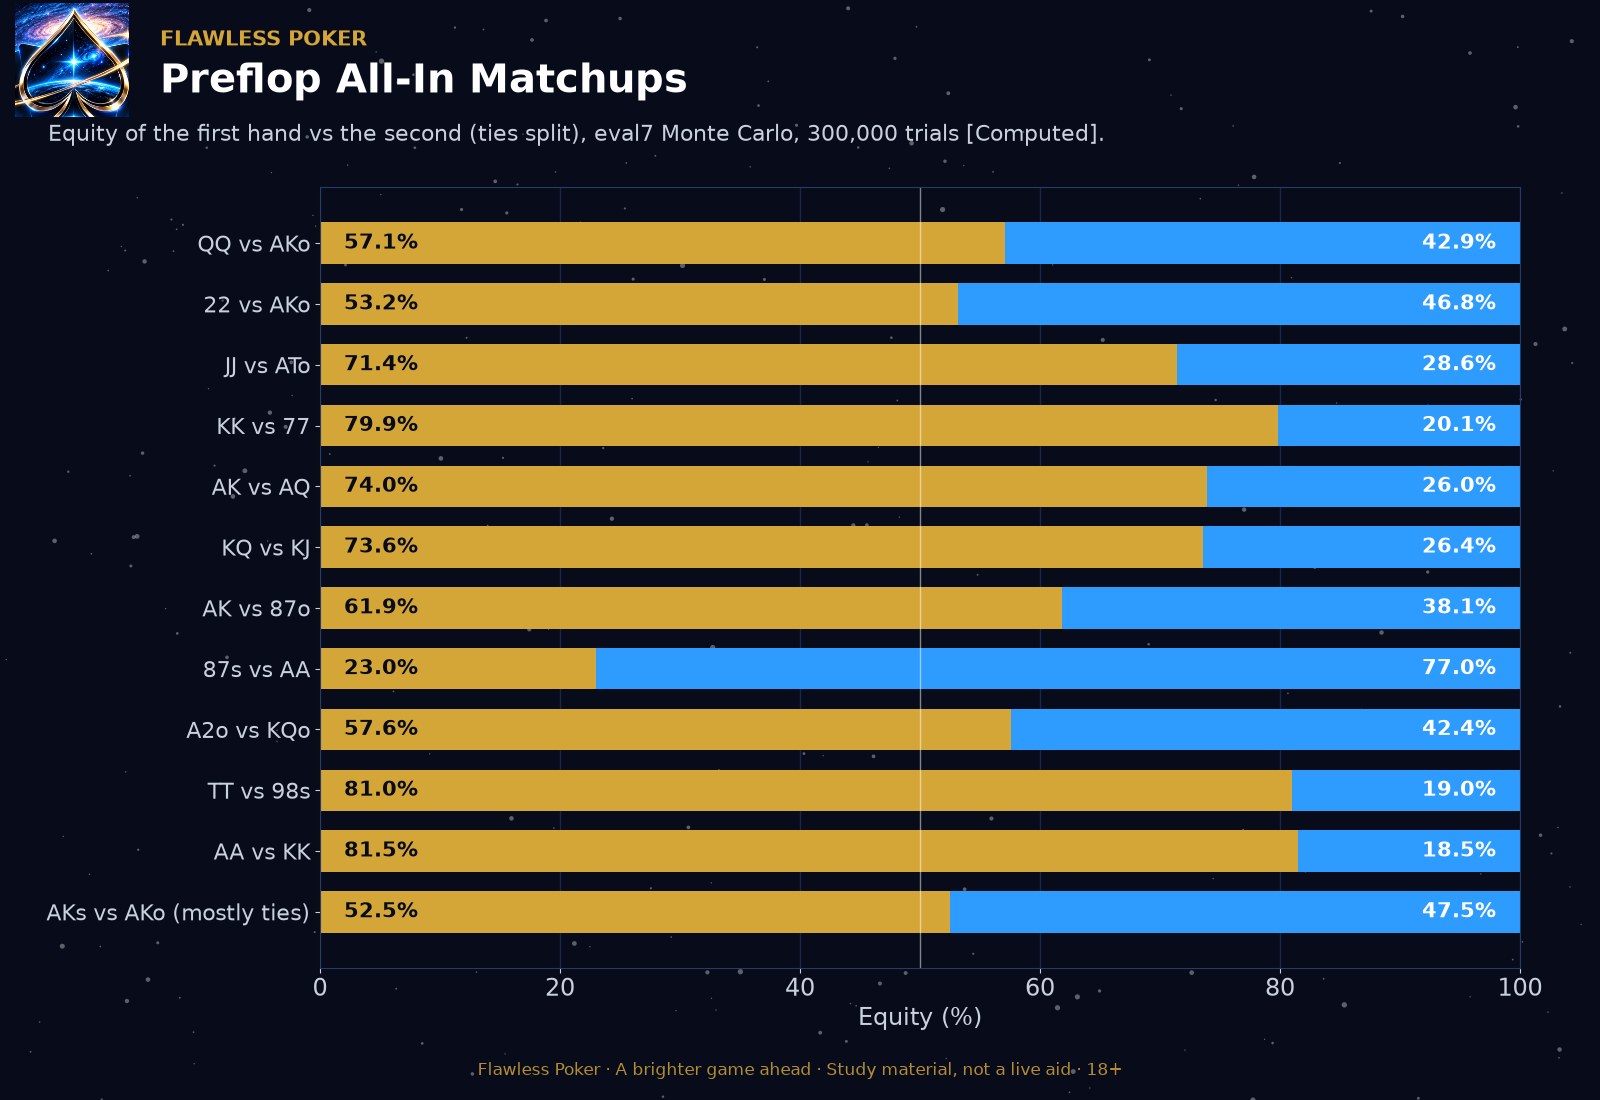
A pair against two overcards is close to a coin flip in these rows, about 53% to 57% for the pair. A pair against two undercards is about 80/20. A dominated hand, sharing a card and holding the worse kicker, sits near 25% to 30% when it is the underdog, as king-queen is against ace-king. Ace-king against ace-queen is the other side of that domination, 74% once ties are shared.
Aces against the crowd.
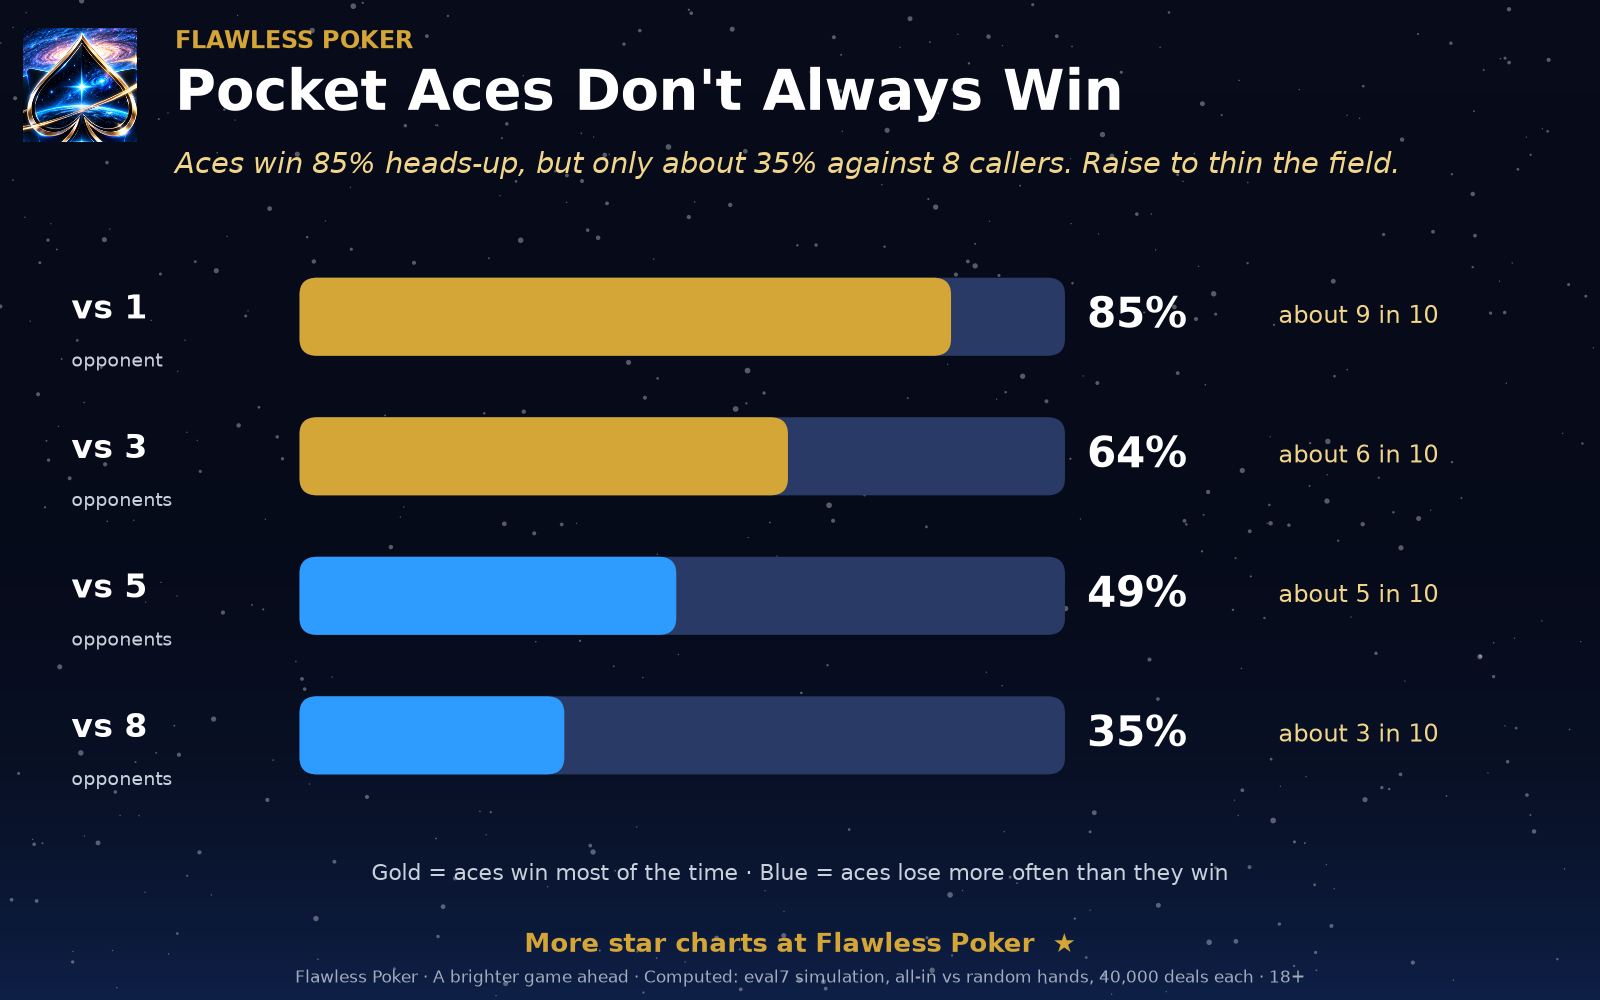
Pocket aces are the best starting hand. They are not a lock once more random hands see a showdown. These shares are simulations of 200,000 deals each, against that many random hands.
| Random opponents | Aces' equity |
|---|---|
| 1 | 85.3% |
| 2 | 73.4% |
| 3 | 63.9% |
| 5 | 49.2% |
| 8 | 34.6% |
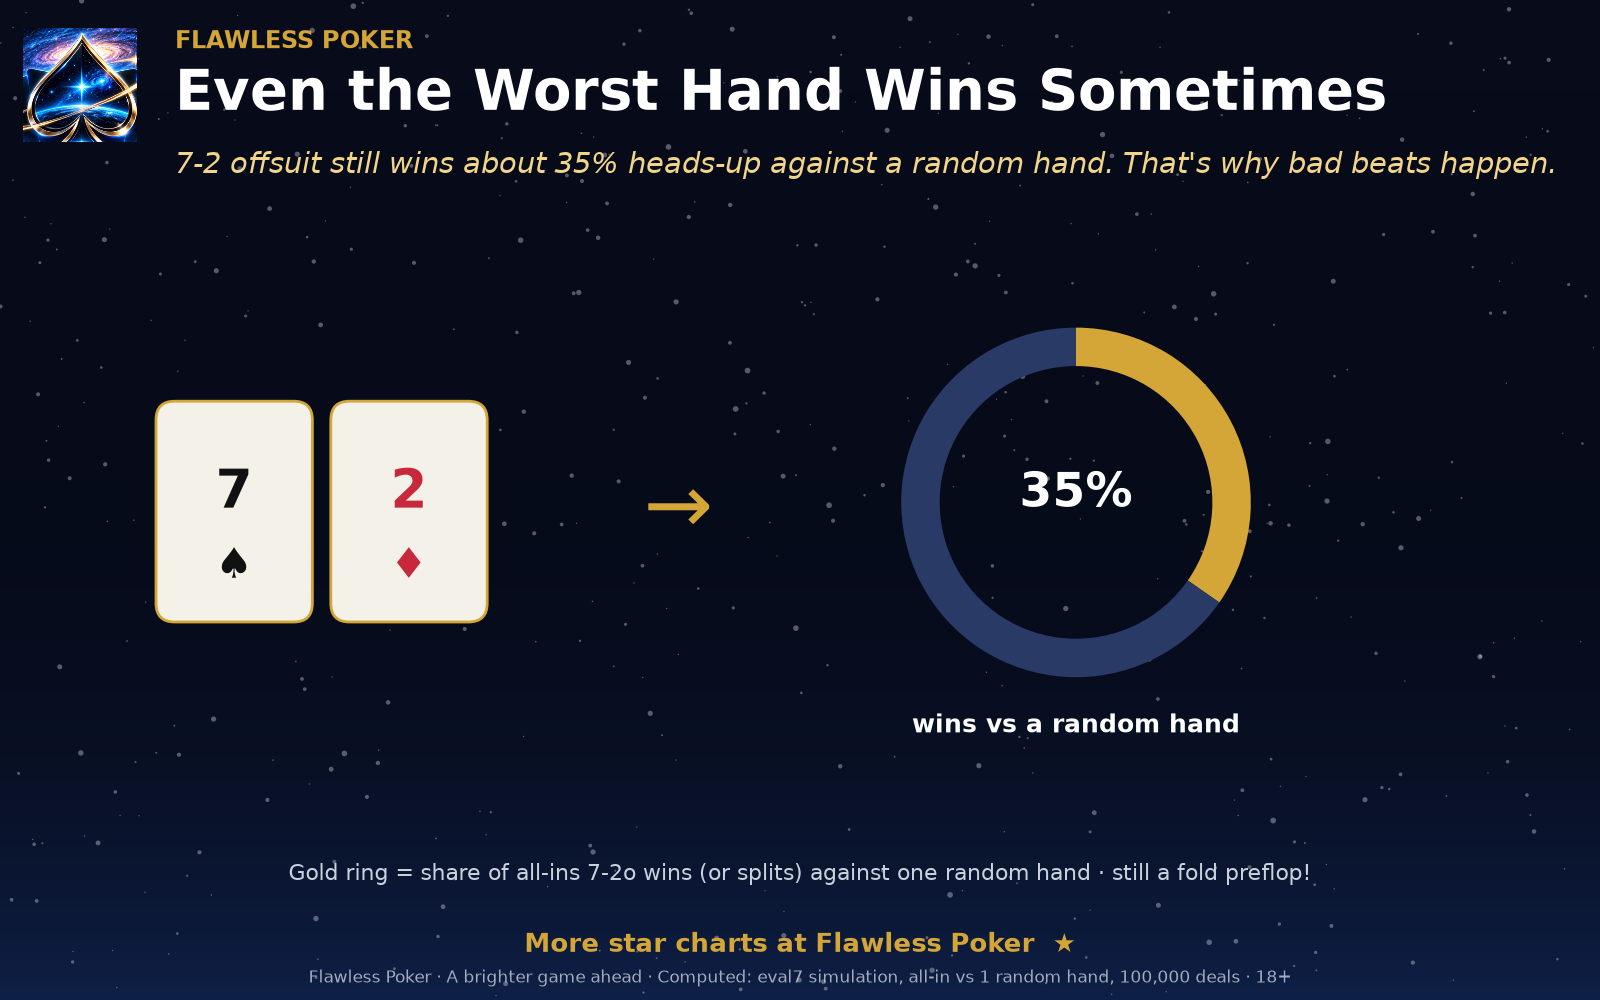
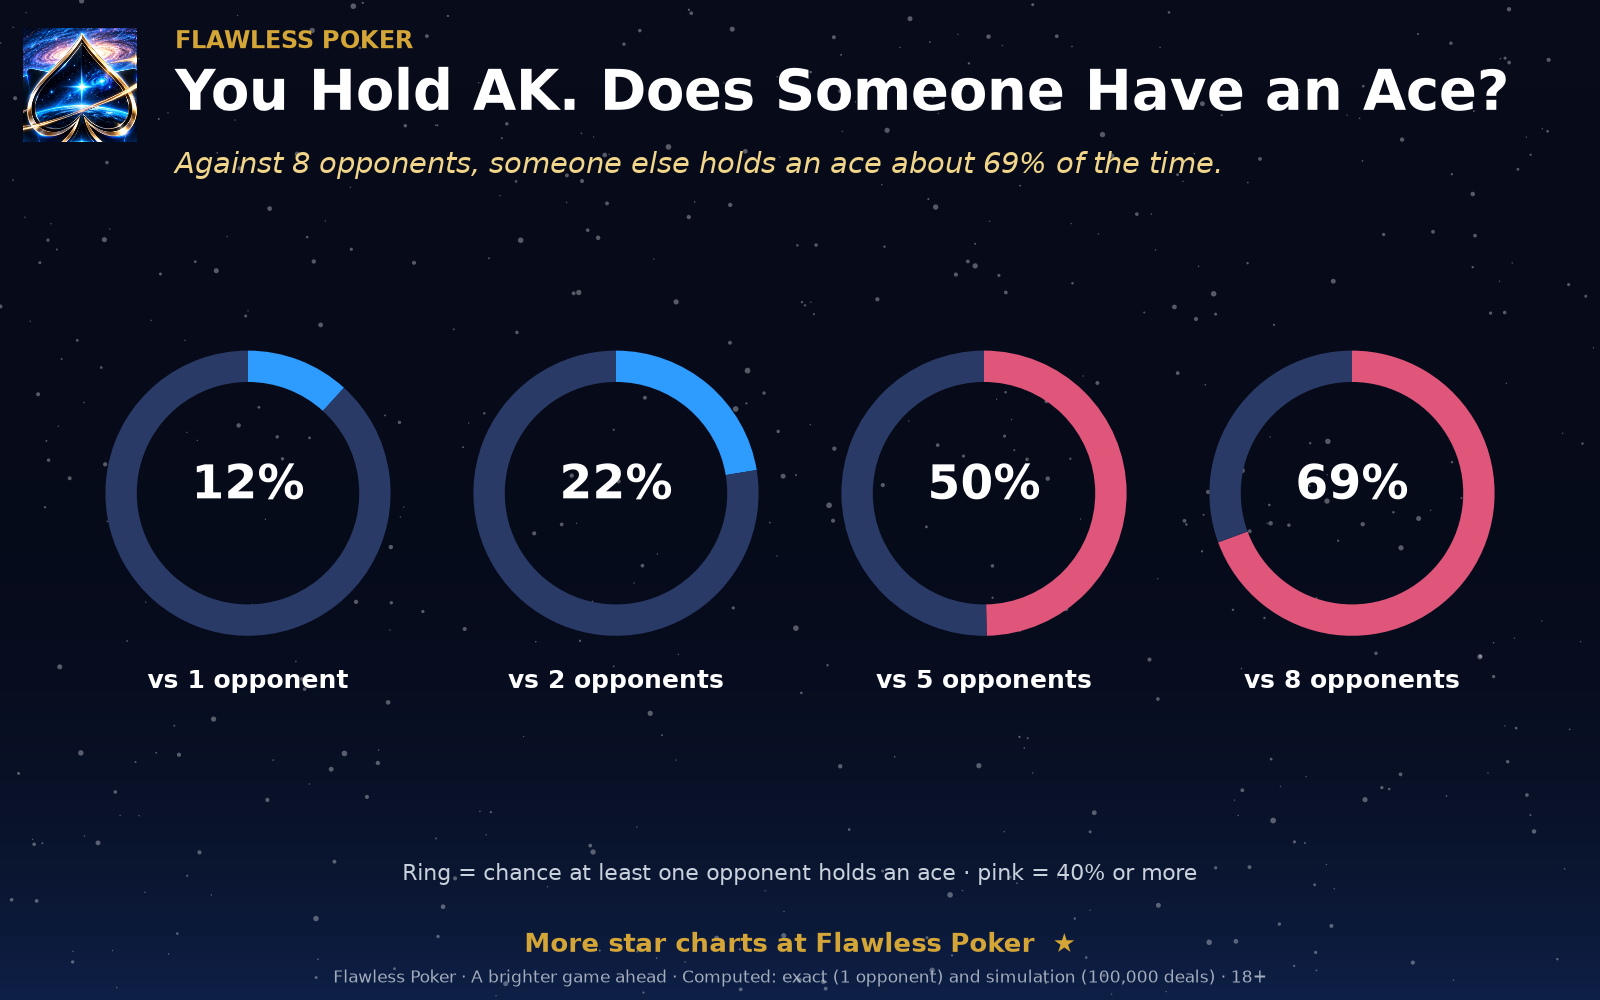
Seven-deuce offsuit still wins about 35% of preflop all-ins against one random hand. That is why a bad beat happens, and why seven-deuce is still folded in a normal game. If you hold ace-king, one opponent holds an ace in 144 of the 1,225 hands they can be dealt, 11.8%. The picture shows that chance climbing as more random hands are dealt.
Preflop all-in matchups
Pocket aces against more opponents
Even the worst hand wins sometimes
When you hold ace-king, who else has an ace?
These counts are for study and post-session review. Where a row comes from a simulation, the caption names how many deals were run. Where a stack or a pot is made up, the caption says so. None of these figures is an instruction for a live pot.