Skip to Universal Law
Flawless Poker

Universal Law 08

COSMIC NOISE

Variance and sample size

Results swing in the short run. A measured win rate is a sample, and the sample has a width you can calculate once you assume a standard deviation.

A win rate is usually written in big blinds per 100 hands. No-limit hold'em is commonly given a standard deviation of roughly 60 to 100 bb/100, and aggressive six-max play is often put higher, about 80 to 120 or more. Those bands are industry ranges. The widths below take a standard deviation as given and compute a 95% interval: about 1.96 times the standard deviation, divided by the square root of the number of 100-hand blocks.

How wide a measured win rate stays. The standard deviation is an assumption. The ± is the calculation.
Standard deviationHandsWin rate known to within
80 bb/10010,000±15.7 bb/100
80 bb/10050,000±7.0 bb/100
80 bb/100100,000±5.0 bb/100
80 bb/100500,000±2.2 bb/100
100 bb/10010,000±19.6 bb/100
100 bb/10050,000±8.8 bb/100
100 bb/100100,000±6.2 bb/100
100 bb/100500,000±2.8 bb/100
After 10,000 hands, a measured +5 bb/100 is almost no information.

At 80 bb/100 of noise, the 95% band is about ±16. A reading of +5 is compatible with a true rate from roughly −11 to +21. Even 100,000 hands, at that same noise, leaves about ±5. Judge the decisions. The result needs a much longer sample before it can judge you.

The three swing pictures use a model with a stated win rate and a standard deviation of 95 bb/100. Change either assumption and the curve moves. They are not a forecast for one player, and they are not a promise that a downswing stops at a drawn line.

FLAWLESS POKER / STUDY CHART

Chance of being ahead after more hands
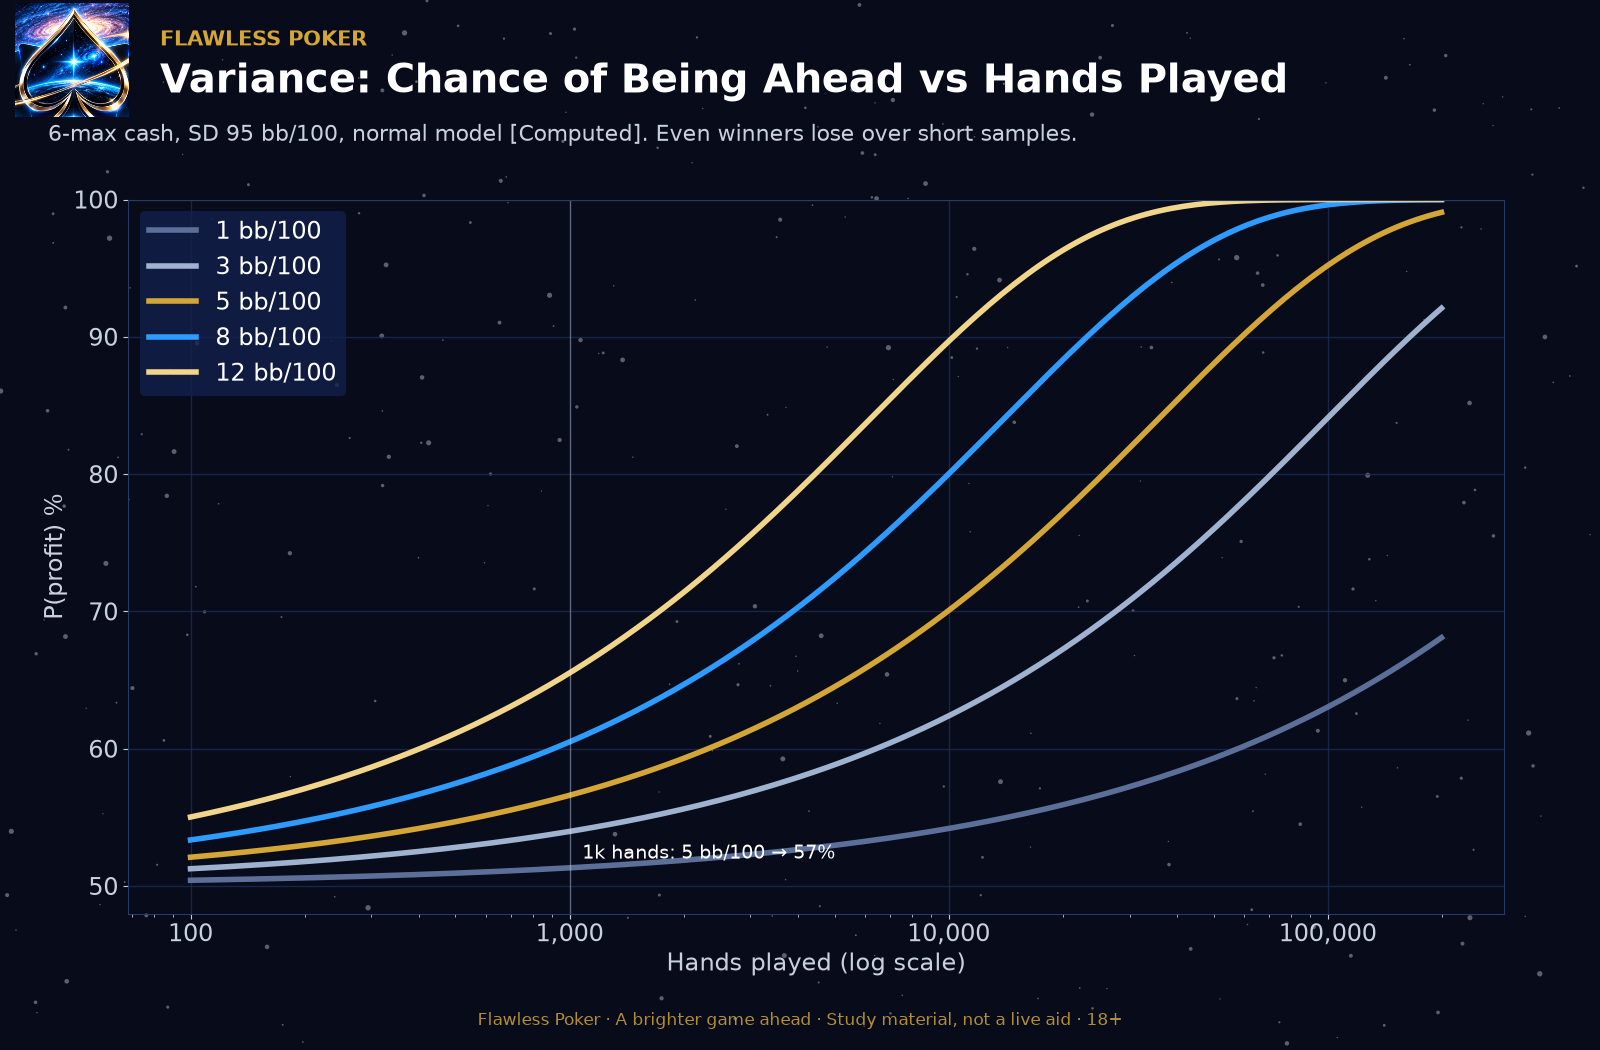
Modeled chance a winning six-max cash player is ahead after 100 to 100,000 hands, for win rates from 1 to 12 big blinds per 100.
A normal model with a 95 bb/100 standard deviation. A 5 bb/100 winner is ahead after 1,000 hands only about 57 percent of the time. Short samples stay close to a coin flip even for a solid winner. Open full-size chart ↗
FLAWLESS POKER / STUDY CHART

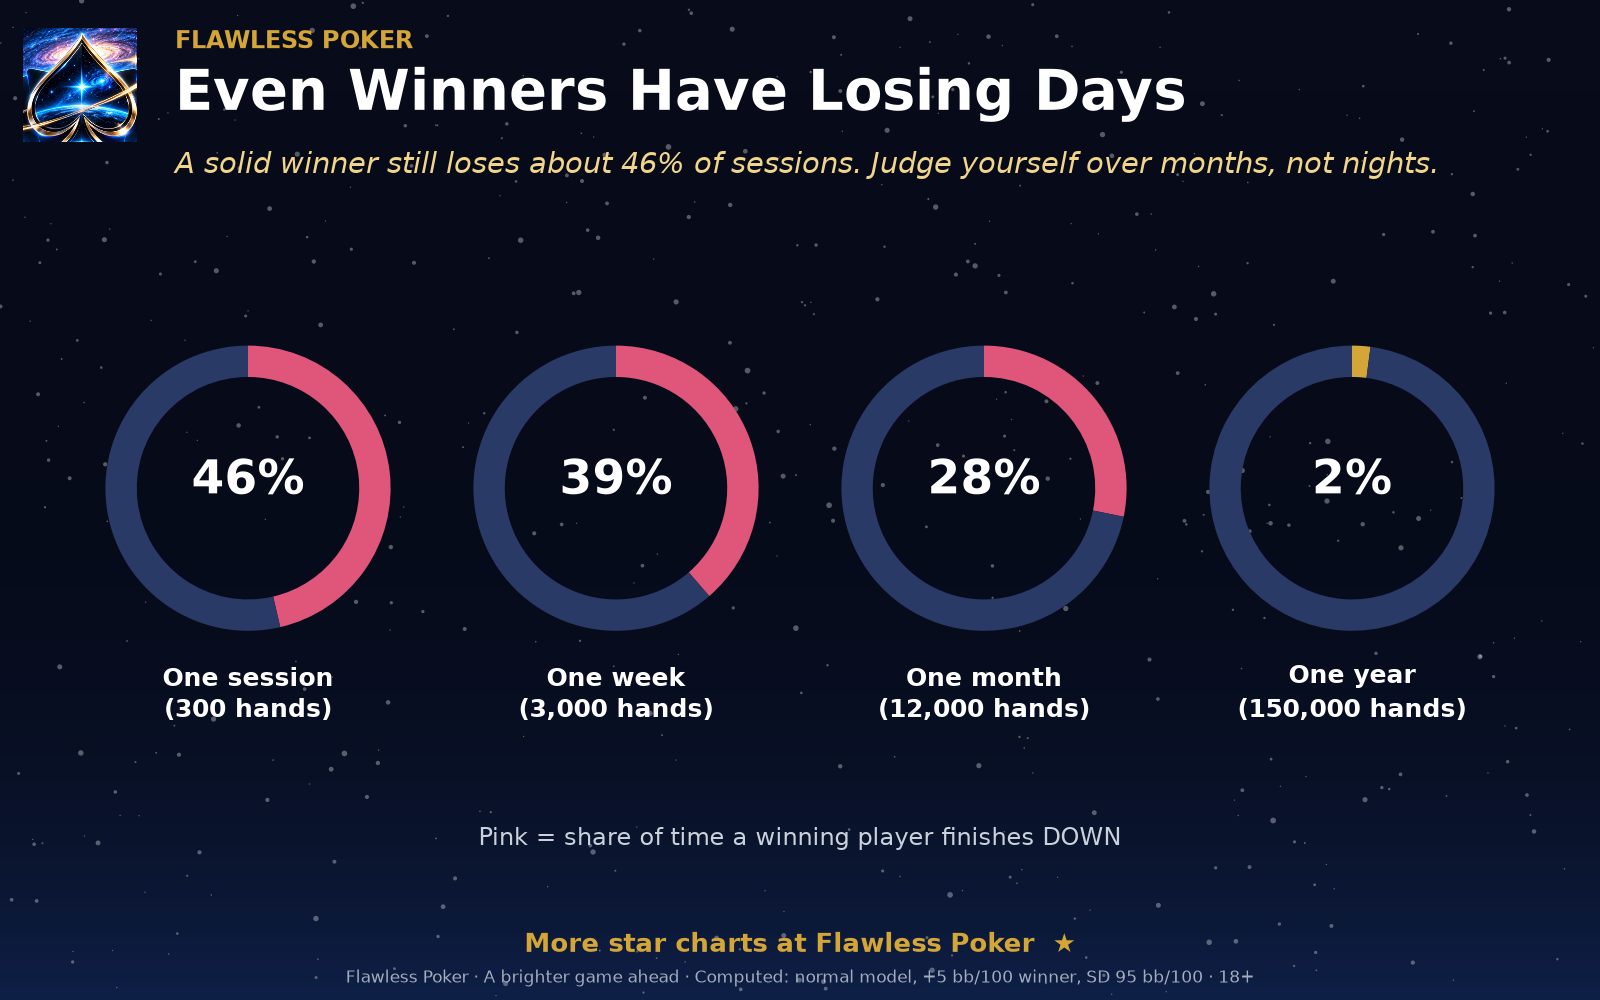
Even winners have losing days

Modeled chance for a winning player to finish down over a session, week, month, and year under stated win-rate and variance assumptions.
A model using a 5 bb/100 win rate and 95 bb/100 standard deviation. These percentages are not a prediction for a particular player; actual results depend on game, volume, win rate, and variance. Open full-size chart ↗
FLAWLESS POKER / STUDY CHART

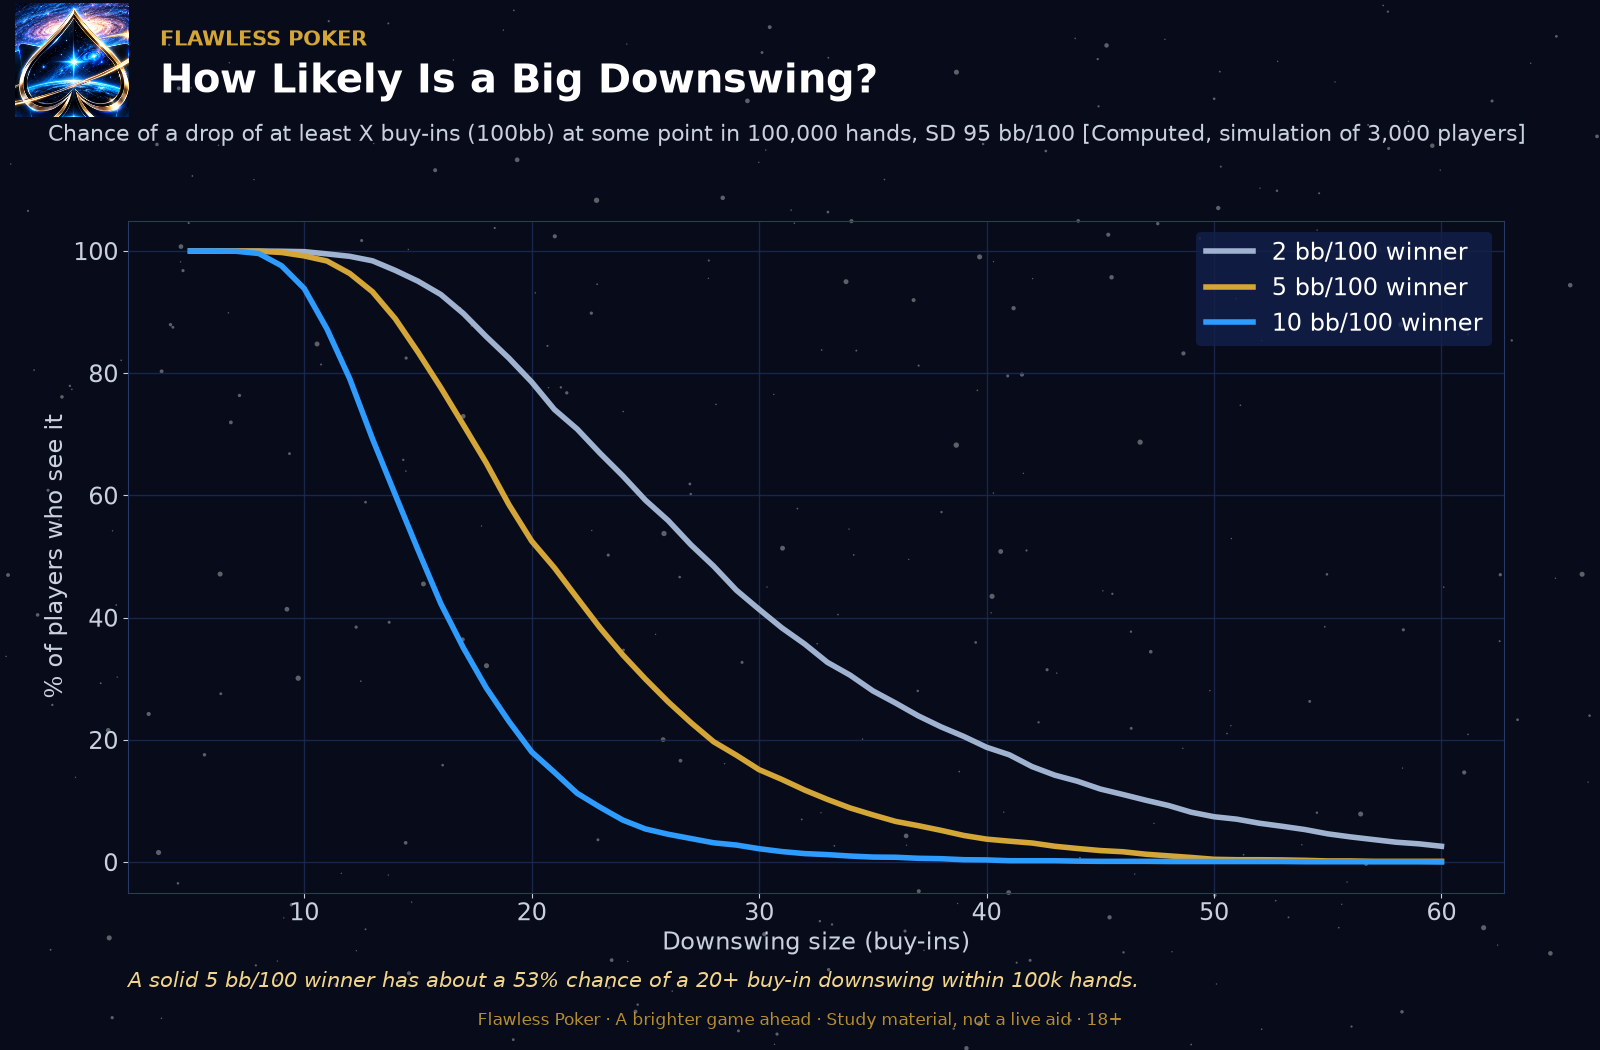
How likely is a big downswing?

Modeled chance of a drop of at least a given number of 100-big-blind buy-ins during 100,000 hands, for 2, 5, and 10 big blinds per 100 winners.
A simulation of 3,000 players with a 95 bb/100 standard deviation. Under those assumptions, a 5 bb/100 winner has about a 53 percent chance of a 20-buy-in drop at some point in 100,000 hands. It is a model, not a forecast for one person. Open full-size chart ↗

A sample is also a bad place to name a player.

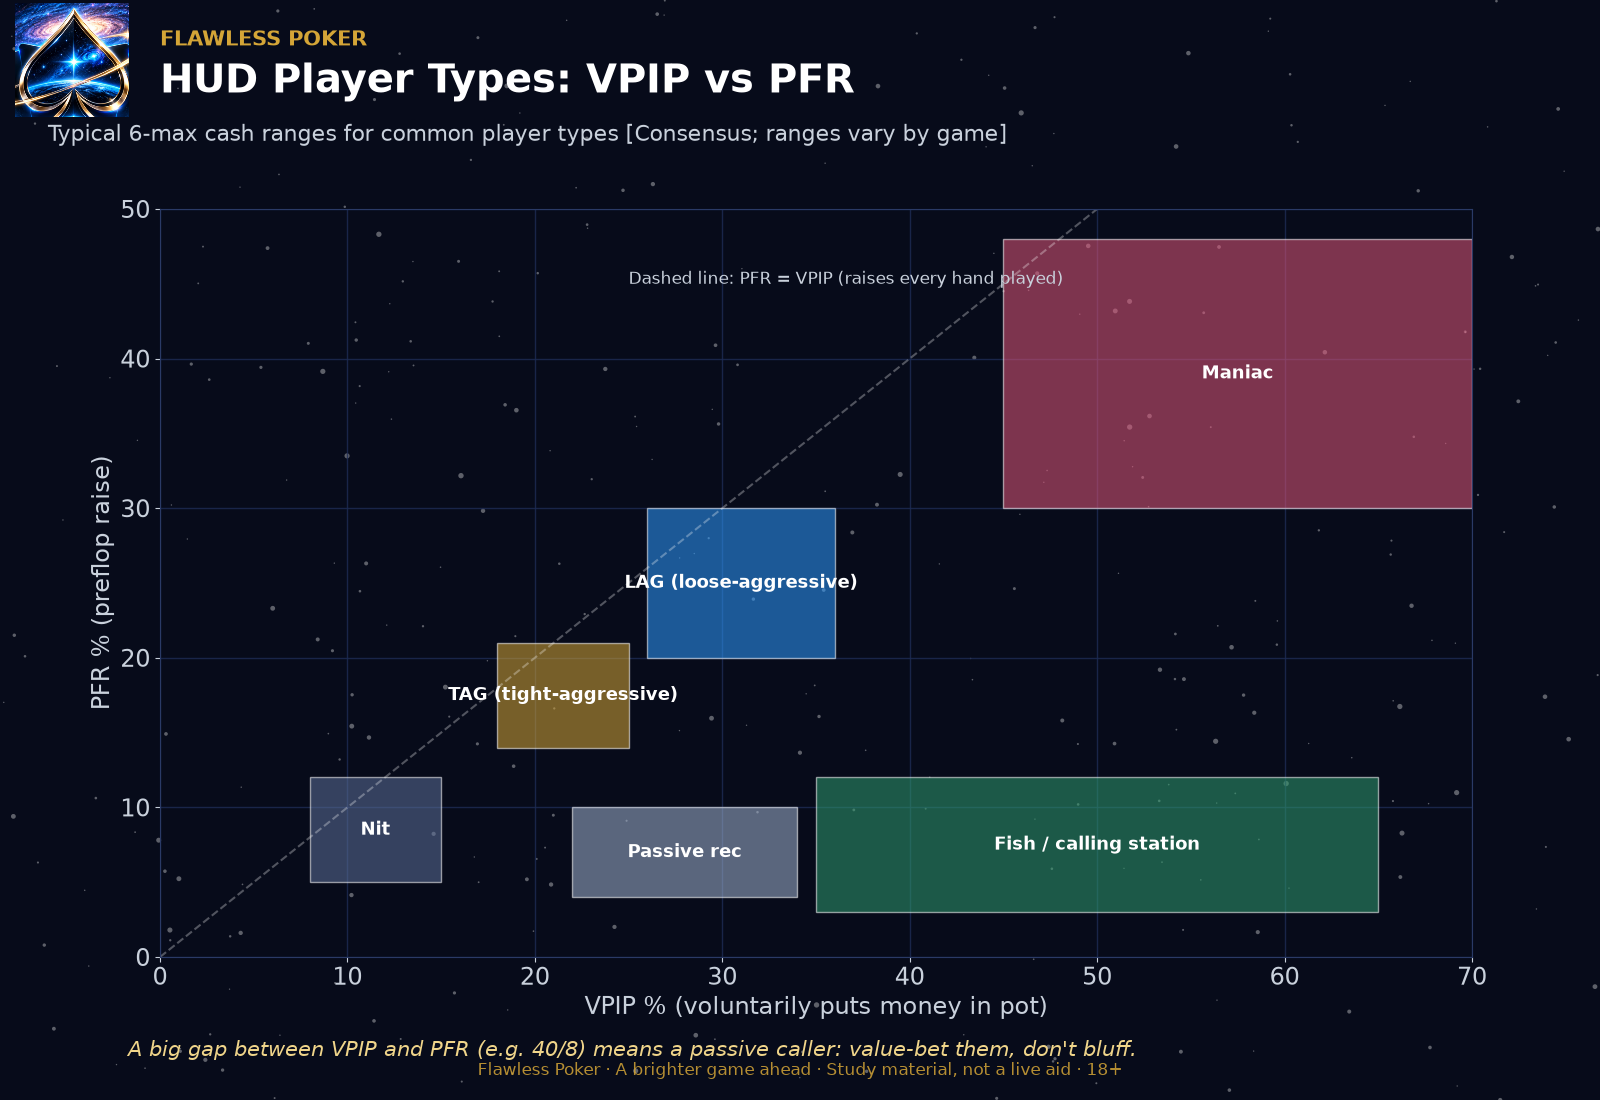
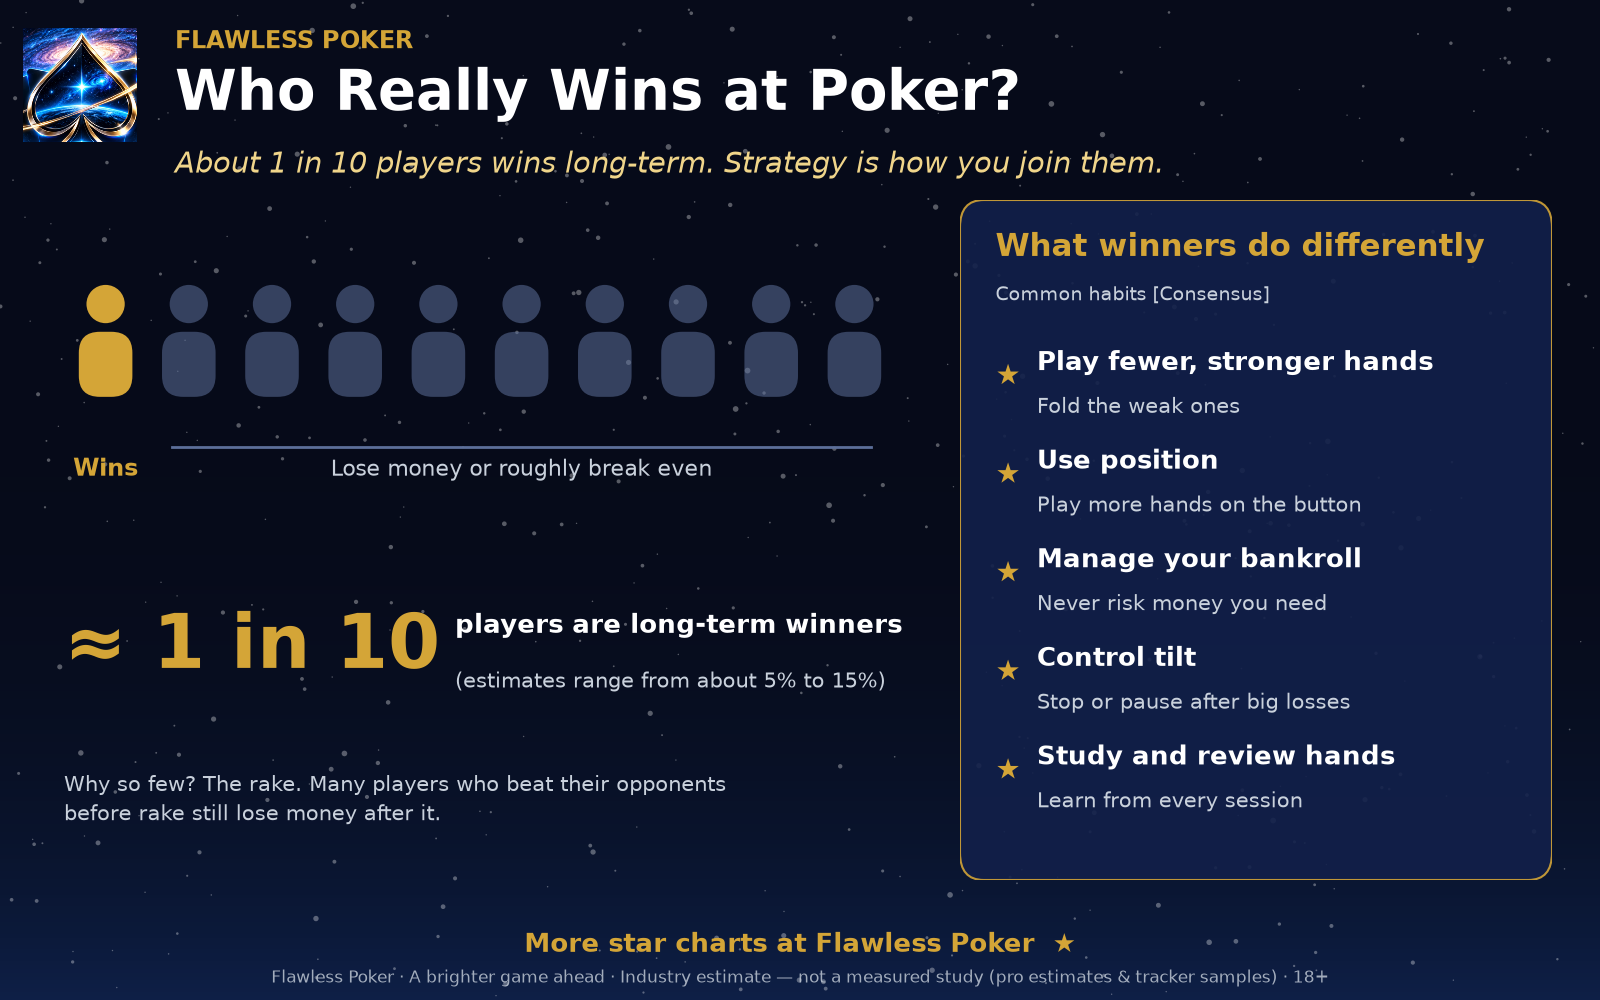
VPIP is the share of hands where someone chose to put chips in before the flop. Posting a blind does not count. PFR is the share they raised. The gap between them is a rough picture of calling versus raising, and it needs position, stack depth, and a real number of hands. The labels on the chart are coaching buckets. The habits picture uses an industry estimate that about one player in ten wins over a long run. That estimate is not a census.

FLAWLESS POKER / STUDY CHART

HUD player types: VPIP and PFR

Illustrative VPIP versus preflop raise regions for common six-max cash player profiles, from tight players to loose and passive players.
These are broad coaching labels, not measured population boundaries. VPIP and PFR need a meaningful sample and context such as position, stakes, format, and opponents before they support a read. Open full-size chart ↗
FLAWLESS POKER / STUDY CHART

Who wins at poker?

Illustrative one-in-ten winning-player estimate with five study habits: selective hands, position, bankroll management, tilt control, and hand review.
The share of long-term winners is an industry estimate, not a measured population result. The habits are general study themes; results depend on game selection, rake, skill, and sample size. Open full-size chart ↗

These counts are for study and post-session review. Where a row comes from a simulation, the caption names how many deals were run. Where a stack or a pot is made up, the caption says so. None of these figures is an instruction for a live pot.