
The Independent Chip Model turns stacks into a share of the prize pool. The usual version, Malmuth-Harville, removes the chip leader in proportion to stack size, then repeats for the next place. It is a widely used model. It is not a law of the cards, and it ignores skill, blinds still to be posted, and how the opponents play.
| Player | Stack | Share of chips | Share of the prize pool |
|---|---|---|---|
| Chip leader | 5,000 | 50% | 37.8% |
| Second stack | 3,000 | 30% | 31.3% |
| Third stack | 1,500 | 15% | 22.6% |
| Short stack | 500 | 5% | 8.4% |
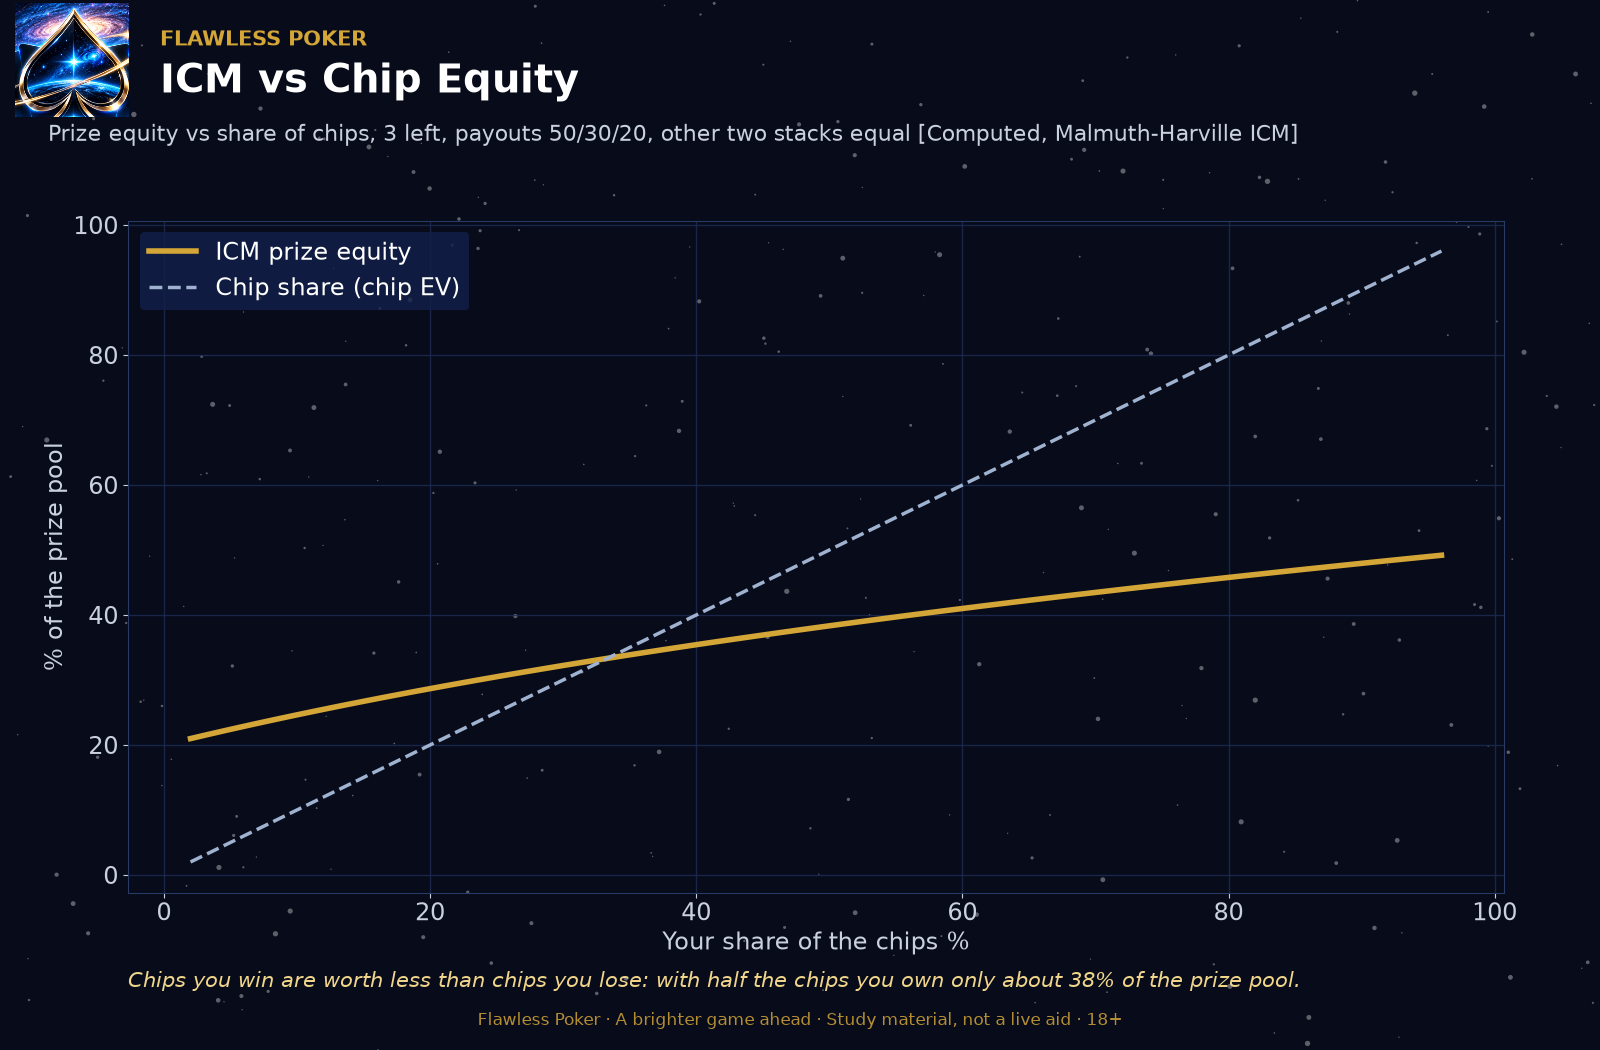
The leader holds half the chips and about 37.8% of the money, because first prize is only half the pool. The short stack holds 5% of the chips and about 8.4% of the money, because it can still ladder. That gap is why calls get tighter near a pay jump. The picture is a different three-player example of the same idea: prize equity is not chip share.
M-ratio and the push-fold region.
M is the stack divided by the cost of one orbit of blinds and antes: how many orbits you can sit through without playing a hand. A stack of 6,000, blinds of 100/200, and antes totalling 225, costs 525 a round. M is 6,000 ÷ 525, which is 11.4. The chips and the blinds are an example. The division is not.
Room to play.
A commonly quoted comfort zone. It is a rule of thumb, not a count of the deck.
10 to 20, then 6 to 10.
The same guides call these the tightening bands. Exact hands still depend on the table.
All in or fold.
Around 10 to 15 big blinds, a small raise that folds to a re-raise burns too much of the stack. The exact region is cited, not derived, and the hands themselves come from payouts, antes, and position.
ICM prize equity versus chip share
These counts are for study and post-session review. Where a row comes from a simulation, the caption names how many deals were run. Where a stack or a pot is made up, the caption says so. None of these figures is an instruction for a live pot.