
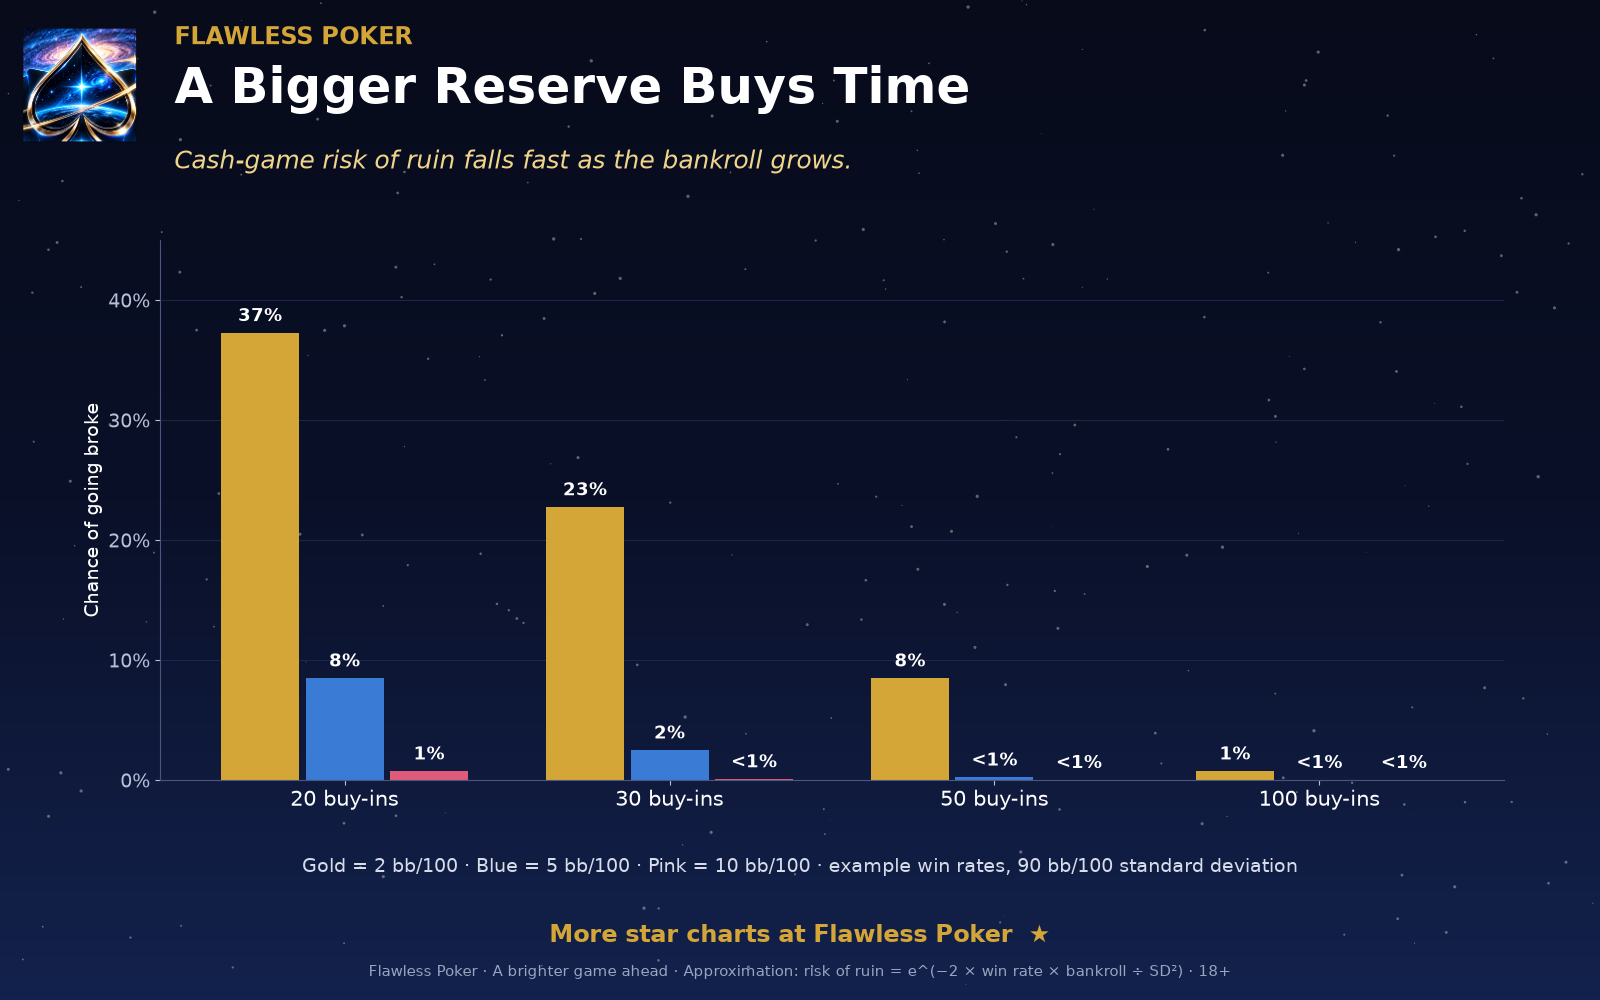
For cash games, a standard approximation is risk of ruin = e^(−2 × win rate × bankroll ÷ SD²), with every term in big blinds per 100 hands. It treats results as a smooth random walk, and it assumes the edge never changes.
| Win rate | 20 buy-ins | 30 buy-ins | 50 buy-ins | 100 buy-ins |
|---|---|---|---|---|
| 2 bb/100 | 37.24% | 22.73% | 8.47% | 0.72% |
| 5 bb/100 | 8.47% | 2.46% | 0.21% | under 0.01% |
| 10 bb/100 | 0.72% | 0.06% | under 0.01% | under 0.01% |
Sit-and-gos and tournaments.
Sit-and-go example model: 9 players, 50/30/20 payouts, 1.10 buy-in with a 1.00 prize-pool share. The player finishes 1st, 2nd and 3rd 13.5% of the time each, which is an ROI of 10.5%. Ruin means the running total dips below the bankroll at any point within 2,000 games.
| Bankroll (buy-ins) | Ruin within 2,000 games |
|---|---|
| 10 | 39.2% |
| 20 | 16.4% |
| 30 | 6.5% |
| 50 | 1.1% |
| 100 | 0.0% |
Tournament example model: 1,000 entrants, 150 paid, 1.10 buy-in, a simplified payout table (first place about 167 buy-ins' worth of the 1,000 pool). The player cashes 19.8% of the time, for an ROI of 20%.
| Bankroll (buy-ins) | Ruin within 2,000 events |
|---|---|
| 50 | 60.7% |
| 100 | 36.4% |
| 200 | 12.5% |
| 300 | 3.9% |
| 500 | 0.2% |
Real win rates drift and players move between stakes. Use these numbers to compare reserves, not to forecast a career. Many players quote 30–50 buy-ins for cash and 100+ for tournaments as starting rules of thumb.
A bigger reserve buys time
These counts are for study and post-session review. Where a row comes from a simulation, the caption names how many deals were run. Where a stack or a pot is made up, the caption says so. None of these figures is an instruction for a live pot.